Major developments in Acton appear to left with lots of unsold units
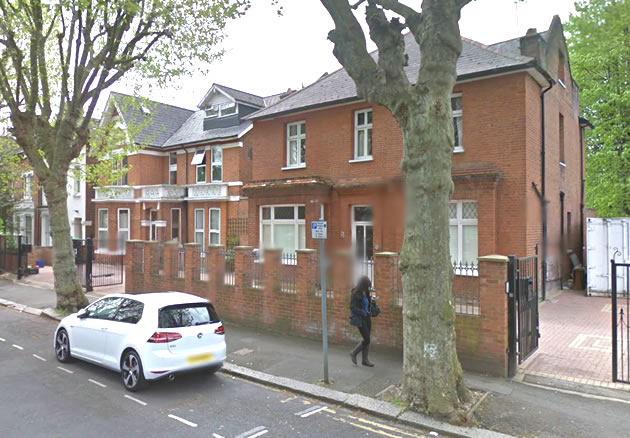
Two properties on Heathfield Road sell for high prices. Picture: Google Street View
|
Fears are growing of a property glut in Acton after the latest figures from the Land Registry appear to show that sales of new build flats have ground to a halt.
None of the hundreds of flats that have been completed recently are reported as being sold on the Land Registry site and only six have appeared since the end of last September.
We have asked Countryside Properties, the developer of Acton Gardens for an explanation as to the lack of reported sales and have yet to receive a response. Other developers of major projects in the Acton area have also failed to reply.
Sales at discounts including those of 'affordable' discount to market units are not recorded by the Land Registry but they would only make up a small proportion of the ongoing developments.
Local agents have said that stamp duty changes and regulatory and tax changes making buy-to-let investment less attractive have led to a collapse in demand for flats in the area. Acton had been seen as an attractive place to buy partly due to proximity to Acton Mainline station but it is understood that developments in sub-optimal area such as the Vida project close to the A40 have been having problems selling units for nearly a year. The secondary market is also extremely quiet with just 34 units reported as sold between January and March this year.
Overall volumes continue to decline with just 56 sales reported in the W3 post code area so far this year but there seems to be residual demand for large family properties with two neighbouring houses on Heathfield Road selling for not much under £2 million.
The average price of an Acton property remains close to its all-time high at £623,384 up by 8.2% over the year but this cannot be taken as a reliable guide to the direction of the market given the low volumes. The rises are partly driven by a higher proportion of houses to flats being sold recently.

According to the Nationwide House Price Index, property values in London as a whole fell by 1% in March compared with the same month last year. For the UK overall prices are up by 2.1% and the gap between the capital and the rest of the country has been slowly reduced over the last few months.
Commenting on the figures, Robert Gardner, Nationwide's Chief Economist, said: “Looking ahead, much will depend on how broader economic conditions evolve, especially in the labour market,
but also with respect to interest rates. Subdued economic activity and the ongoing squeeze on household budgets is likely to continue to exert a modest drag on housing market activity and house price growth this year."
Home ownership rates have declined across all English regions over the past decade. While the decline has been fairly uniform across regions, the biggest reduction has been in London, where the home ownership rate has fallen from 57% to 47%. The counterpart to this has been robust growth in the private rental sector; for example, 30% of households in London now rent.
The RICs say that their surveyor members report on balance an expectation of no price rises over the next 12 months representing the joint lowest reading since February 2013. Regionally, there continues to be significant variation in the house price indicator. London, exhibits the weakest feedback, with a net balance of -47% of respondents citing further price declines.
There are regular updates on the local property market in the ActonW3.com newsletter. To register to receive it click here.
| Acton Property Prices (January - March 2018) | ||||||||||
|---|---|---|---|---|---|---|---|---|---|---|
| Area | Detached | Sales | Semi-det | Sales | Terraced | Sales | Flat/ mais |
Sales | Overall Ave |
Total Sales |
| W3 0 | 0 | 0 | 745583 | 3 | 200000 | 1 | 565000 | 1 | 600350 | 5 |
| W3 6 | 973793 | 3 | 1012500 | 1 | 1002000 | 5 | 465543 | 7 | 762667 | 16 |
| W3 7 | 0 | 0 | 815000 | 1 | 733750 | 4 | 407904 | 12 | 508521 | 17 |
| W3 8 | 0 | 0 | 0 | 0 | 685000 | 1 | 394719 | 8 | 426972 | 9 |
| W3 9 | 0 | 0 | 1533333 | 3 | 0 | 0 | 436250 | 6 | 801944 | 9 |
| Total | 973793 | 3 | 1083031 | 8 | 802727 | 11 | 426291 | 34 | 623384 | 56 |
| Change in Quarter | - | - | 6.7% | -42.9% | 10.0% | -38.9% | -0.9% | -46.9% | -0.9% | -43.4% |
| Change in year | - | - | 32.6% | -50.0% | -12.1% | -59.3% | -7.2% | -74.2% | 8.2% | -68.4% |
| Change in three years | - | - | 27.9% | -38.5% | 8.9% | -35.3% | 23.9% | -57.0% | 32.9% | -49.1% |
| Change in five years | - | - | 64.8% | -68.0% | 44.8% | -62.1% | 43.6% | -73.4% | 60.9% | -69.2% |
| Change in ten years | - | - | 82.9% | -70.4% | 73.6% | -50.0% | 53.0% | -63.0% | 69.7% | -60.3% |
May 10, 2018
![]()