Seven bedroom house becomes area's most expensive ever
|
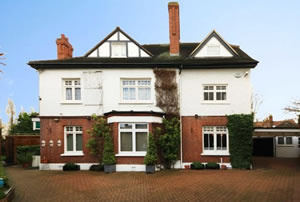
A new record has been set for the price paid for a home in the W3 post code area with the sale of a house in King Edwards Gardens for £3,150,000.
The seven bedroom house close to Ealing Common takes over from a property on Cumberland Park which broke the previous record for the area in 2014 at a price of £2,700,000.
The sale took place towards the end of 2015, a year in which property prices in Acton rose on average by 17.1% to £578,600 according to the Land Registry well in excess of the rest of London. The rise was led by flats which make up two thirds of all sales in the area and increased by 22.1%
The overall average is not at an all-time high. The peak for this measure was reached in the third quarter of 2014 but since then flats have made up a larger proportion of sales driving down the average.
 Property prices across London rose by 12.4% in 2015 according to the Land Registry bringing the average price of a home in the capital up to £514,097. This was the highest rate of increase in the country.
The average property value in England and Wales was up by 6.4% £188,270. Monthly house prices rose by 1.2% since November 2015.
Sales and repossessions during October 2015, the most up-to-date figures available, show that the number of repossessions in London fell by 71%
The London housing market has seen a fall in newly agreed sales for a third month in a row according to the latest RICS UK Residential Market Survey. Despite an increase in demand across the capital 2% more surveyors have seen a fall in newly agreed sales over the last month, adding to the picture from October and November.
Their report for December 2015 has shown that demand for new properties has reached a three-month high, with Chartered Surveyors citing a rush to beat April’s stamp duty rise as the reason.
From April, buy-to-let investors will be required to pay 3% more in stamp duty charges than residential buyers looking to purchase the same home. Since the Chancellor announced these measures in the Autumn Statement last November, 10% more Chartered Surveyors in London reported a rise in new buyer enquiries but with new instructions flat prices are continuing to rise - average sales per surveyor are at just half of what they were in June 2014.
RICS Chief Economist, Simon Rubinsohn said, “The housing market has experienced an unusually buoyant December. Those in the industry have been speculating that this is the result of the Chancellor’s announcement last November. Potential buy-to-let investors are looking to pick up properties before the increased stamp duty levy comes into force in April. If that is the case, then we can expect to see the housing market heating up further over the next few months.”
The survey also predicted that house prices in London look set to rise by a further 5% per annum in each of the next five years, compared to a UK average of 4.5%, with 57% of contributors in the capital believing that property was either ‘expensive’ or ‘very expensive’.
A net balance of 25% of respondents reported that London house prices had risen since November, substantially lower than the national average of 50%, however price expectations remained strong with a 30% more London surveyors predicting a rise rather than fall in prices over the coming three months.
In a forthcoming edition of the ActonW3.com newsletter there will be a complete listing of recent property sales in the area. To register to receive it click here.
| Acton Property Prices (October - December 2015) | ||||||||||
|---|---|---|---|---|---|---|---|---|---|---|
| Area | Detached | Sales | Semi-det | Sales | Terraced | Sales | Flat/ mais |
Sales | Overall Ave |
Total Sales |
| W3 0 | 0 | 0 | 780000 | 1 | 734200 | 10 | 434167 | 6 | 631000 | 17 |
| W3 6 | 810000 | 2 | 756667 | 3 | 914667 | 9 | 446525 | 20 | 619191 | 34 |
| W3 7 | 0 | 0 | 560000 | 1 | 839583 | 6 | 402806 | 31 | 475907 | 38 |
| W3 8 | 0 | 0 | 1026800 | 2 | 773828 | 6 | 517560 | 20 | 608849 | 28 |
| W3 9 | 0 | 0 | 1082488 | 4 | 1190000 | 1 | 411095 | 11 | 627625 | 16 |
| Total | 810000 | 2 | 908504 | 11 | 826390 | 32 | 441997 | 88 | 578600 | 133 |
| Change in Quarter | -19.6% | -50.0% | -15.8% | -60.7% | 2.3% | 6.7% | 8.8% | -35.3% | 0.7% | -32.8% |
| Change in year | 18.2% | -47.6% | -0.6% | 68.4% | 22.1% | -4.3% | 17.1% | 0.8% | ||
| Change in three years | 35.9% | -66.7% | 50.2% | 14.3% | 41.2% | -25.4% | 39.2% | -25.7% | ||
| Change in five years | 53.9% | -52.2% | 76.9% | 39.1% | 73.0% | 1.1% | 59.7% | -2.2% | ||
| Change in ten years | 120.9% | -66.7% | 136.3% | -28.9% | 117.5% | -29.0% | 114.4% | -34.2% | ||
| Acton Property Prices (July-September 2015) | ||||||||||
|---|---|---|---|---|---|---|---|---|---|---|
| Area | Detached | Sales | Semi-det | Sales | Terraced | Sales | Flat/ mais |
Sales | Overall Ave |
Total Sales |
| W3 0 | 0 | 0 | 690667 | 6 | 442233 | 3 | 440000 | 4 | 556208 | 13 |
| W3 6 | 310000 | 1 | 1038150 | 2 | 886714 | 7 | 348661 | 31 | 473215 | 41 |
| W3 7 | 0 | 0 | 1116556 | 8 | 899250 | 10 | 381097 | 32 | 602401 | 50 |
| W3 8 | 895000 | 1 | 0 | 0 | 769866 | 10 | 445192 | 59 | 498000 | 70 |
| W3 9 | 1412500 | 2 | 1255698 | 12 | 0 | 0 | 420450 | 10 | 920745 | 24 |
| Total | 1007500 | 4 | 1079326 | 28 | 807495 | 30 | 406136 | 136 | 574295 | 198 |
| Change in Quarter | 18.5% | 75.0% | -3.6% | 30.4% | 4.4% | 63.9% | 6.0% | 62.3% | ||
| Change in year | 11.1% | -6.7% | -12.6% | -25.0% | 5.6% | 58.1% | -10.3% | 26.1% | ||
| Change in three years | 55.6% | 27.3% | 47.8% | -14.3% | 43.5% | 33.3% | 44.4% | 24.5% | ||
| Change in five years | 58.8% | 0.0% | 65.5% | 25.0% | 64.3% | 27.1% | 56.7% | 22.2% | ||
| Change in ten years | 147.1% | -31.7% | 141.9% | -31.8% | 98.4% | 56.3% | 96.0% | 15.1% | ||
February 18, 2016