Concern heightened over housing affordability in W3
|
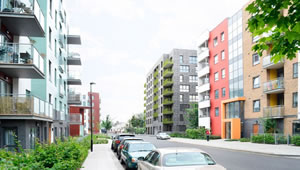
South Acton has become the epicentre of the local property price boom with the recent marketing of flats in the Acton Gardens development.
The area which was formerly part of one of the largest council estates in West London is now seeing flats in developments such as Shanklin Court and Stapleton Court change hands for over half a million. The average price of a flat in W3 has surpassed £400,000 for the first time.
There were nearly 200 properties sold in the W3 post code area during the third quarter of this year according to the Land Registry, the highest level for two years. The overall average price level has actually fallen due to a drop in demand for houses and the surge in the volume of transactions for flats. The level is now £574,295 which down by 10.3% from the record level seen in same period last year.
The prices being achieved in Acton Gardens are likely to raise further concerns about the lack of affordable housing in the borough. The reduction in the number of social housing units in the South Acton estate has significantly cut the stock of property available for people in need in the area.
The most expensive property sold during this period was a 5 bed house in Creswick Road which went for £1.8million.
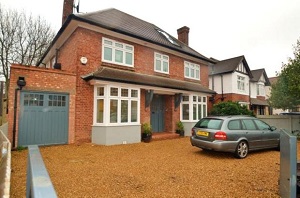
Creswick Road house went for £1.8 million
 The September figures from the Land Registry’s Market Trend Data survey show that London remains the country’s best performing area in terms of residential property price rises. The average price in the capital is now just short of half a million at £499,997 up by 9.6% over the last year. The average property value in England and Wales rose by 5.3%to £186,553. Monthly house prices up 1.0 per cent since August 2015.
The number of completed house sales in England and Wales decreased by 4% to 81,696 compared with 84,691 in July 2014. The number of properties sold in England and Wales for over £1 million in July 2015 decreased by 9% to 1,413 from 1,555 a year earlier. Repossessions in England and Wales decreased by 50 per cent to 471 compared with 943 in July 2014 with only 36 taking place in London during the month.
In October, 25% more chartered surveyors in London saw house prices rise according to the latest RICS UK Residential Market Survey, compared to a balance of 26% more in September, showing a steady increase month-on-month.
However, only 5% more chartered surveyors are expecting a rise in prices in the capital over the next three months – this is the lowest reading across the UK over this time period. Despite this, the twelve month view for the capital is still relatively strong with 53% more respondents expecting prices to increase.
Demand from potential buyers grew modestly across London in October with 7% more respondents seeing a rise in new buyer enquiries. Demand continues to considerably outpace supply and the number of new instructions decreased for the ninth month in succession, with 9% more chartered surveyors reporting a fall, contributing to the rise in prices in the capital. The supply of new listings to the UK market as a whole has been in decline since the start of the 2015 with a decrease in new instructions in London every month this year.
In the London lettings market, demand increased at broadly similar pace to that of supply in the three months to October, as new landlord instructions rose at the quickest quarterly pace since early 2014. Nevertheless, rental expectations remain strong and respondents continue to expect rents to rise over the year ahead. Rental growth in the London is anticipated to accelerate to an average of around 4.5% per year over the coming five years.
Simon Rubinsohn, RICS Chief Economist, commented, “It is hard to get away from the issue of supply when it comes to the current state of the housing market. The legacy of the drop in new build following the onset of the global financial crisis is now really hitting home with both the sales and letting markets continuing to show demand outstripping supply on a month by month basis. And if the five year projections from members regarding the outlook for both prices and rents is anything to go by, property is set to become even more unaffordable going forward making the governments focus of boosting to delivery of new homes absolutely critical.”
Changes to the tax regime have also had an impact in the top end of the market with the turnover of larger family houses in the area falling.
Adrian Gill, director of Reeds Rains and Your Move estate agents, said, “The Chancellor’s intimidating Stamp Duty remodel is still spooking the top end of the London market. Properties worth over £1.5 million have been hit with a stamp duty increase, currently set at 12% of the portion of the property’s value above £1.5m, up from 5% previously. As a result, sales of homes worth more than £1.5 million have fallen by 35% in Q3, compared to a year ago. This tax has really put the shackles on the prime market in the capital, as three quarters of these sales since January 2014 took place in London. “
In a forthcoming edition of the ActonW3.com newsletter there will be a complete listing of recent property sales in the area. To register to receive it click here.
| Acton Property Prices (July-September 2015) | ||||||||||
|---|---|---|---|---|---|---|---|---|---|---|
| Area | Detached | Sales | Semi-det | Sales | Terraced | Sales | Flat/ mais |
Sales | Overall Ave |
Total Sales |
| W3 0 | 0 | 0 | 690667 | 6 | 442233 | 3 | 440000 | 4 | 556208 | 13 |
| W3 6 | 310000 | 1 | 1038150 | 2 | 886714 | 7 | 348661 | 31 | 473215 | 41 |
| W3 7 | 0 | 0 | 1116556 | 8 | 899250 | 10 | 381097 | 32 | 602401 | 50 |
| W3 8 | 895000 | 1 | 0 | 0 | 769866 | 10 | 445192 | 59 | 498000 | 70 |
| W3 9 | 1412500 | 2 | 1255698 | 12 | 0 | 0 | 420450 | 10 | 920745 | 24 |
| Total | 1007500 | 4 | 1079326 | 28 | 807495 | 30 | 406136 | 136 | 574295 | 198 |
| Change in Quarter | 18.5% | 75.0% | -3.6% | 30.4% | 4.4% | 63.9% | 6.0% | 62.3% | ||
| Change in year | 11.1% | -6.7% | -12.6% | -25.0% | 5.6% | 58.1% | -10.3% | 26.1% | ||
| Change in three years | 55.6% | 27.3% | 47.8% | -14.3% | 43.5% | 33.3% | 44.4% | 24.5% | ||
| Change in five years | 58.8% | 0.0% | 65.5% | 25.0% | 64.3% | 27.1% | 56.7% | 22.2% | ||
| Change in ten years | 147.1% | -31.7% | 141.9% | -31.8% | 98.4% | 56.3% | 96.0% | 15.1% | ||
| Acton Property Prices (April - June 2015) | ||||||||
|---|---|---|---|---|---|---|---|---|
| Area | Semi-det | Sales | Terraced | Sales | Flat/ mais |
Sales | Overall Ave | Total Sales |
| W3 0 | 700000 | 2 | 643400 | 5 | 247500 | 2 | 568000 | 9 |
| W3 6 | 994750 | 2 | 900156 | 8 | 343957 | 35 | 471761 | 45 |
| W3 7 | 723125 | 8 | 1255000 | 2 | 419500 | 19 | 560879 | 29 |
| W3 8 | 951000 | 1 | 792916 | 8 | 442735 | 17 | 570032 | 26 |
| W3 9 | 1482667 | 3 | - | - | 425200 | 10 | 669231 | 13 |
| Total | 910844 | 16 | 837895 | 23 | 388946 | 83 | 542029 | 122 |
| Change in Quarter | 7.5% | 23.1% | 13.6% | 35.3% | 13.0% | 5.1% | 15.5% | 10.9% |
| Change in year | -0.2% | -44.8% | 22.6% | 15.0% | 15.9% | -15.3% | 7.8% | -18.7% |
| Change in three years | 55.2% | -36.0% | 56.2% | -17.9% | 37.4% | -35.2% | 48.8% | -32.6% |
| Change in five years | 81.7% | -40.7% | 92.8% | -8.0% | 54.5% | 7.8% | 59.7% | -5.4% |
| Change in ten years | 140.7% | -40.7% | 155.8% | -34.3% | 92.6% | -4.6% | 105.8% | -18.1% |
November 12, 2015
![]()