Brexit failing to discourage purchases in the W3 area
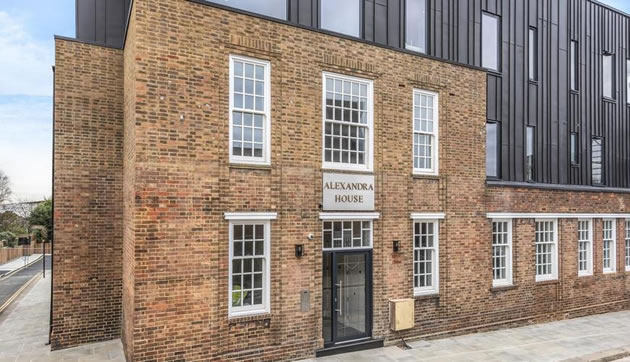
Units at Alexandra House appear to be selling
|
The economic uncertainty experienced so far this year is failing to discourage many people from buying a home in Acton.
Although the number of recent sales reported to the Land Registry is not high by historic standards, the W3 postcode area seems to be holding up better than other parts of London. Unusually there were more reported transactions in Acton W3 than in Chiswick W4 during the second quarter of the year.
After what appeared to be something of a buyers’ strike in 2018 for new build properties, there has been a pick up this year in Acton with a number of new developments coming to the market including the Acton Town Hall apartments, Alexandra House on Oldham Terrace in South Acton and Leighfield Court behind Tesco Metro in East Acton.
In all 20 brand new apartments were sold during the second quarter. This follows on from a late surge of sales in the first quarter which saw 58 new units changing hands.
Larger houses in the area also remain relatively popular with twelve transactions over £1,000,000 during the period, the highest of which was a semi-detached property in Montague Gardens, West Acton which went for £1,785,000.
The average price of a property sold in the W3 postcode area during the second quarter was up by 1% to £565,115.
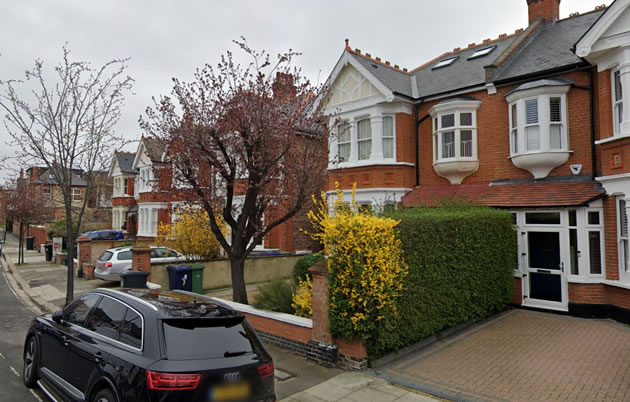
Property in Montague Gardens sold for £1,785,000. Picture: Google Streetview
One local estate agent said, “There is an element of the ‘squeezed middle’ in Acton at the moment with very low demand for bog standard terraces which make up a lot of local housing stock. The secondary market for flats is also very subdued. What the developers have realised is that they have to offer very generous incentives to buyers so in many cases stamp duty and legal fees are being paid as well as extra fittings being included in the price. Combined with the support offered by Help to Buy, it is clear why people are still willing to take the plunge. My advice would be to bargain hard on new build purchases and benefit from every incentive they are prepared to offer – there are some great deals to be had.”

According to the Nationwide House Price Index the average sale price in London was £465,722 down by 3.8% in the second quarter compared to the previous three months. Over the last year prices are down by 0.7% This is the eighth consecutive quarterly decline for London in a row. Moreover, prices in the capital are still only around 5% below the all-time highs recorded on Q1 2017 and c50% above their 2007 levels (by comparison, UK prices are only around 17% higher over the same period).
For the UK as a whole the average sale price was up by 0.4% over the last year to £215,910 with Northern Ireland seeing the strongest performance.
Commenting on the figures, Robert Gardner, Nationwide's Chief Economist, said, “Survey data suggests that new buyer enquiries and consumer confidence have remained subdued in recent months. Nevertheless, indicators of housing market activity, such as the number of mortgages approved for house purchase, have remained broadly stable.
“Housing market trends are likely to continue to mirror developments in the broader economy. While healthy labour market conditions and low borrowing costs will provide underlying support, uncertainty is likely to continue to act as a drag on sentiment and activity, with price growth and transaction levels remaining close to current levels over the coming months.”
The RICS UK Residential Market Survey for the second quarter concluded, “Although anecdotal commentary from respondents remains generally a little downbeat, contributors reported a rise in buyer demand, that new instructions have held steady, and that newly agreed sales also edged into positive territory for the first time in twenty-eight months.”
There are regular updates on the local property market in the ActonW3.com newsletter. To register to receive it click here.
| Acton Property Prices (April - June 2019) | ||||||||||
|---|---|---|---|---|---|---|---|---|---|---|
| Area | Detached | Sales | Semi-det | Sales | Terraced | Sales | Flat/ mais |
Sales | Overall Ave |
Total Sales |
| W3 0 | 845000 | 1 | 656450 | 4 | 815000 | 1 | 444833 | 3 | 624478 | 9 |
| W3 6 | 0 | 0 | 750000 | 3 | 1107375 | 4 | 335000 | 12 | 563132 | 19 |
| W3 7 | 0 | 0 | 741667 | 3 | 1050000 | 1 | 438095 | 21 | 499000 | 25 |
| W3 8 | 690000 | 2 | 0 | 0 | 673667 | 3 | 422325 | 20 | 473900 | 25 |
| W3 9 | 0 | 0 | 1161000 | 5 | 793750 | 2 | 0 | 0 | 1056071 | 7 |
| Total | 741667 | 3 | 860387 | 15 | 900273 | 11 | 410732 | 56 | 565115 | 85 |
| Change in Quarter | - | - | -9.3% | -6.3% | 14.0% | -8.3% | -8.7% | -45.1% | 1.5% | -35.6% |
| Change in year | - | - | -0.4% | 50.0% | 22.0% | -45.0% | -11.9% | -45.1% | 1.0% | -37.0% |
| Change in three years | - | - | -15.0% | 66.7% | 4.0% | -8.3% | -0.3% | -17.6% | 5.8% | -5.6% |
| Change in five years | - | - | -5.7% | -48.3% | 31.7% | -45.0% | 22.4% | -42.9% | 12.4% | -43.3% |
| Change in ten years | - | - | 101.0% | -21.1% | 127.1% | -47.6% | 75.5% | 40.0% | 75.1% | 6.3% |
August 15, 2019
![]()