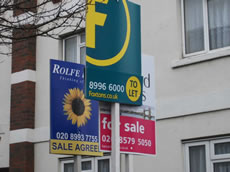
Average property price in Acton now over £400,000
|
The cost of buying a home in Acton is on the up - reflecting a growing local trend which is being put down to the 'Crossrail effect'.
Estate agents throughout the borough believe the impact of the new rail link, scheduled for 2018, is beginning to show itself with increased confidence in the local property market.
Luke Simpson from Aston Rowe says: '' Acton is an area of choice. Both homebuyers and savvy investors are going to sealed bids on Acton’s local housing stock. Some are selling up in more perilous areas such as Kensington and Notting Hill to live in Acton which is becoming increasingly trendier and even better connected.
''The effect of the Crossrail is being reflected by the substantial increase in buy to let properties in Poet’s Corner and around the Mainline Station. ''
A recent property report described W3 as great value for money - an overlooked area that is catching up with its chic neighbours.
Prices for the fourth quarter of 2012 are up 4.5% on previous three months which itself was a record. This is up 2.5% on same period last year. The average price for a property in Acton now just over £415,000.
Flat prices have also hit at new record - they're excahnging hands for over £300,000 for the first time.
The volume of sales is good - showing more movement in the market - which always makes estate agents happy - figures are up by 55.7% on same period three years ago.
The surge comes after prolonged period in the doldrums. Up by 20.5% over five years and 71.9% over ten years
London was the best performing part of England and Wales during 2012 with an increase of 8.4% The average price of a home in London is now £371,223 according to the Land Registry.
For England and Wales as a whole prices rose by 1.7% over the year to £162,080.
The most up-to-date figures available show that during October 2012, the number of completed house sales in England and Wales decreased by 3 per cent to 56,337 compared with 57,988 in October 2011.
The number of properties sold in England and Wales for over £1 million in October 2012 increased by 14 per cent to 623 from 548 in October 2011.
All regions saw a decrease in repossessions between October 2011 and October 2012 ranging from 8 per cent in the South East to 35 per cent in the North East.
The numbers below are subject to revision as is it usual that some properties are added late to the Land Registry's database.
In a forthcoming edition of the ActonW3.com newsletter there will be a complete listing of recent property sales in the area. To register to receive it click here.
Acton Property Prices - October to December 2012 |
||||||||
|---|---|---|---|---|---|---|---|---|
| Area | Semi-Det | Sales | Terraced | Sales | Flat/Mais | Sales | Total Ave | Total Sales |
| W3 0 | 0 | 0 | 517000 | 6 | 390600 | 5 | 459545 | 11 |
| W3 6 | 769300 | 5 | 605200 | 5 | 281555 | 28 | 388317 | 38 |
| W3 7 | 512000 | 11 | 597722 | 9 | 332082 | 59 | 387397 | 79 |
| W3 8 | 652664 | 7 | 487150 | 8 | 272565 | 13 | 428900 | 28 |
| W3 9 | 800955 | 10 | 0 | 0 | 305115 | 13 | 520698 | 23 |
| Total | 668385 | 33 | 550168 | 28 | 313044 | 118 | 415646 | 179 |
| Change in Quarter | -3.7% | 50.0% | 0.7% | -20.0% | 10.6% | 15.7% | 4.5% | 12.6% |
| Change in year | 11.1% | 37.5% | 1.1% | 86.7% | 36.4% | 38.8% | 22.4% | 44.4% |
| Change in three years | 46.6% | 83.3% | 42.5% | 86.7% | 27.8% | 43.9% | 40.2% | 55.7% |
| Change in five years | 27.5% | 26.9% | 16.3% | -15.2% | 13.4% | -8.5% | 20.5% | -4.8% |
| Change in ten years | 88.3% | -25.0% | 76.2% | -34.9% | 72.3% | -11.3% | 71.9% | -18.6% |
Acton Property Prices - July to September 2012 |
||||||||
|---|---|---|---|---|---|---|---|---|
| Area | Semi-Det | Sales | Terraced | Sales | Flat/ Mais |
Sales | Total Ave | Total Sales |
| W3 0 | 484100 | 5 | 394500 | 3 | 322916 | 6 | 395821 | 14 |
| W3 6 | 638750 | 4 | 623457 | 13 | 252103 | 29 | 390672 | 46 |
| W3 7 | 537083 | 6 | 540108 | 15 | 294252 | 35 | 386124 | 56 |
| W3 8 | 0 | 0 | 432875 | 4 | 268339 | 14 | 304903 | 18 |
| W3 9 | 1009285 | 7 | 0 | 0 | 309136 | 18 | 505178 | 25 |
| Total | 693772 | 22 | 546330 | 35 | 283024 | 102 | 397818 | 159 |
| Change in Quarter | 18.2% | -12.0% | 1.8% | 25.0% | 0.0% | -20.3% | 9.2% | -12.2% |
| Change in year | 39.0% | 46.7% | 5.3% | 9.4% | 15.9% | 18.6% | 17.3% | 19.5% |
| Change in three years | 46.2% | 120.0% | 28.6% | 84.2% | 8.3% | 72.9% | 24.0% | 80.7% |
| Change in five years | 28.9% | -48.8% | 8.0% | -28.6% | 5.1% | -30.1% | 8.5% | -33.2% |
| Change in ten years | 83.7% | -69.4% | 68.6% | -50.0% | 58.5% | -31.1% | 51.2% | -45.2% |
March 14, 2013

