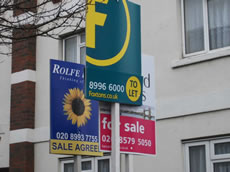
But the number of homes changing hands has slowed down
|
There's been a slight slowdown in property sales in Acton so far this year with 116 properties changing hands - 9 less than the previous quarter.
However, according to the latest data from the Land Registry, the average price of a home sold in W3 during the first quarter of 2012 was £358,812 - which is up 5.7% on the previous three months.
This is above the peak of the market seen last year when the average reached was £339,547 and the level is up 6.4% on the same period last year.
In the longer term, the average is 7.4% above what it was three years ago and 10.5% up over the five years.
Sales of terrace houses and flats appear to be slightly cheaper than the end of last year. The average price for a terraced property now being £468,719 which is down 13.8% on the previous quarter when it was £544,030.
Semi-detached properties are now averaging at £603,115 which is slightly higher than last year.
The number of transactions in the local market has slowed down which may concern estate agents, 116 have changed hands compared to 124 at the end of last year - traditionally a slower time.
Agents are no doubt hoping the sunny weather continues to encourage more transactions.
The March data from Land Registry's flagship House Price Index shows an annual price decrease of 0.6% which takes the average property value in England and Wales to £160,372. London remains the best performing area in the country with prices rising by 0.7% to £343,522 over the same period.
The most up-to-date figures available show that, during January 2012, the number of completed house sales in England and Wales increased by 13% to 42,511 compared to 37,584 in January 2011.
The numbers below are subject to revision as is it usual that some properties are added late to the Land Registry's database.
In a forthcoming edition of the ActonW3.com newsletter there will be a complete listing of recent property sales in the area. To register to receive it click here.
| Acton Property Prices - January - March 2012 | ||||||||
|---|---|---|---|---|---|---|---|---|
| Area | Semi-Det | Sales | Terraced | Sales | Flat/Mais | Sales | Total Averages | Total Sales |
| W3 0 | 405400 | 5 | 487250 | 3 | 313237 | 4 | 395142 | 12 |
| W3 6 | 526500 | 4 | 514785 | 7 | 250312 | 16 | 359796 | 27 |
| W3 7 | 773333 | 3 | 393545 | 10 | 280260 | 19 | 361887 | 32 |
| W3 8 | 0 | 0 | 531000 | 6 | 240722 | 11 | 343173 | 17 |
| W3 9 | 759990 | 5 | 0 | 0 | 258771 | 23 | 348274 | 28 |
| Total | 603115 | 17 | 468719 | 26 | 262775 | 73 | 358812 | 116 |
| Change in Quarter | 0.3% | -29.2% | -13.8% | 73.3% | 14.5% | -14.1% | 5.7% | -6.5% |
| Change in year | 2.2% | -15.0% | -0.5% | 116.7% | 15.3% | 19.7% | 6.4% | 24.7% |
| Change in three years | 64.1% | 183.3% | -3.5% | 225.0% | -0.3% | 265.0% | 7.4% | 241.2% |
| Change in five years | 12.6% | -58.5% | 9.9% | -29.7% | 8.0% | -58.0% | 10.5% | -54.5% |
| Acton Property Prices - October - December 2011 | ||||||||
|---|---|---|---|---|---|---|---|---|
| Area | Semi-Det | Sales | Terraced | Sales | Flat/Mais | Sales | Total Averages | Total Sales |
| W3 0 | 475000 | 4 | 0 | 0 | 163419 | 5 | 301899 | 9 |
| W3 6 | 496666 | 3 | 564500 | 5 | 217967 | 19 | 313106 | 27 |
| W3 7 | 420800 | 5 | 591991 | 6 | 262296 | 27 | 335209 | 38 |
| W3 8 | 0 | 0 | 446500 | 4 | 200019 | 26 | 232883 | 30 |
| W3 9 | 745000 | 12 | 0 | 0 | 283556 | 8 | 560422 | 20 |
| Total | 601417 | 24 | 544030 | 15 | 229522 | 85 | 339547 | 124 |
| Change in Quarter | 20.5% | 60.0% | 4.8% | -53.1% | -6.0% | -1.2% | 0.1% | -6.8% |
| Change in year | 1.9% | 4.3% | 16.5% | -34.8% | -10.2% | -2.3% | -6.3% | -8.8% |
| Change in three years | 47.9% | 100.0% | 43.1% | 66.7% | -9.3% | 150.0% | 10.4% | 125.5% |
| Change in five years | 35.3% | -42.9% | 35.2% | -59.5% | -2.7% | -65.3% | 18.0% | -62.1% |
May 24, 2012
