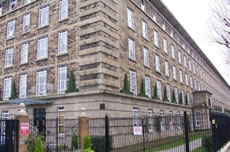
Terrace house prices now approaching half a million
|
Average property prices and the volume of sales in the Acton area has gone up in the last quarter according to new figures.
Terrace houses are now changing hands for an average 487,881 that's an increase of nearly 15% in the last year. Semi detached houses are selling for 679,730 - 43% higher than last year.
There have been more flat sales from July to September (107) but they are down in price terms by 5%
Overall the volume of sales is up with 162 properties changing hands in the last quarter - compared to 129 from April - July.
UK house prices are down overall but buyers are traditionally reluctant to part with their money in the lead-up to Christmas.
According to the Rightmove House Price Index new sellers cut their asking prices by 3.2% in November – the largest decline seen since December 2007. The index said there was now an "unseasonably high number" of unsold properties on the market amid a dearth of first-time buyers and buy-to-let investors.
In London prices were down by just 0.4% in November and remain 3.5% higher than a year ago, compared with the national average of 1.3%. Miles Shipside from Rightmove said : "London's limited property supply and domestic as well as international demand are helping to insulate its property prices from some of the downward pressures being experienced elsewhere in the country
The numbers below are subject to revision as is it usual that some properties are added late to the Land Registry's database.
In a forthcoming edition of the ActonW3.com newsletter there will be a complete listing of recent property sales in the area. To register to receive it click here.
Acton Property Prices - July - September 2010
| Area | Detached | Sales | Semi-Det | Sales | Terrace | Sales | Flat/ Mais |
Sales | Total Ave | Total Sales |
|---|---|---|---|---|---|---|---|---|---|---|
| W3 6 | 720333 | 3 | 429166 | 6 | 514371 | 7 | 233275 | 27 | 340349 | 43 |
| W3 7 | 0 | 0 | 806658 | 6 | 478740 | 11 | 267150 | 49 | 351461 | 66 |
| W3 8 | 0 | 0 | 714375 | 4 | 473733 | 6 | 231108 | 18 | 352137 | 28 |
| W3 9 | 0 | 0 | 730000 | 12 | 0 | 0 | 223538 | 13 | 466640 | 25 |
| Total | 720333 | 3 | 679730 | 28 | 487881 | 24 | 247240 | 107 | 366403 | 162 |
| Change in Quarter | - | - | 35.6% | 3.7% | 12.3% | -4.0% | -1.8% | 39.0% | 8.0% | 25.6% |
| Change in year | - | - | 43.2% | 180.0% | 14.9% | 26.3% | -5.4% | 81.4% | 14.2% | 84.1% |
| Change in three years | - | - | 26.2% | -34.9% | -3.5% | -51.0% | -8.2% | -26.7% | -0.1% | -31.9% |
| Change in five years | - | - | 55.6% | -31.7% | 46.1% | -45.5% | 20.8% | 23.0% | 25.0% | -5.8% |
| Change in ten years | - | - | 120.9% | -20.0% | 114.4% | -33.3% | 83.5% | 5.9% | 93.5% | -5.8% |
Acton Property Prices - April - July 2010
| Area | Semi-Det | Sales | Terraced | Sales | Flat/Mais | Sales | Total Ave | Total Sales |
|---|---|---|---|---|---|---|---|---|
| W3 0 | 323638 | 6 | 440616 | 6 | 301833 | 3 | 366068 | 15 |
| W3 6 | 491237 | 4 | 451631 | 11 | 236236 | 19 | 335923 | 34 |
| W3 7 | 451187 | 8 | 410500 | 4 | 272569 | 30 | 319728 | 42 |
| W3 8 | 562666 | 3 | 403000 | 4 | 219750 | 10 | 323382 | 17 |
| W3 9 | 722133 | 6 | 0 | 0 | 240913 | 15 | 378404 | 21 |
| Total | 501373 | 27 | 434625 | 25 | 251718 | 77 | 339418 | 129 |
| Change in Quarter | -11.9% | 8.0% | 9.3% | 4.2% | 4.8% | -14.4% | 3.9% | -7.2% |
| Change in year | 17.1% | 42.1% | 9.6% | 19.0% | 7.5% | 92.5% | 5.2% | 61.3% |
| Change in three years | -5.9% | -18.2% | 6.2% | -19.4% | -2.0% | -49.7% | 3.3% | -41.4% |
| Change in five years | 32.5% | 0.0% | 32.7% | -28.6% | 24.7% | -11.5% | 28.9% | -13.4% |
| Change in ten years | 86.5% | -52.6% | 69.6% | -37.5% | 92.6% | -26.7% | 64.9% | -38.3% |
19 November 2010
